Moving Average Convergence and Divergence - avoid MACD pitfall in your trading

MACD is used quite widely among traders mainly, it would seem, because the basis for the indicator is something they can visualize – effectively measuring the degree of convergence or divergence of two exponential moving averages. Commonly traders will consider buying or selling on crossover of the MACD lines. However, there can be problems and it is worth understanding when these may occur.
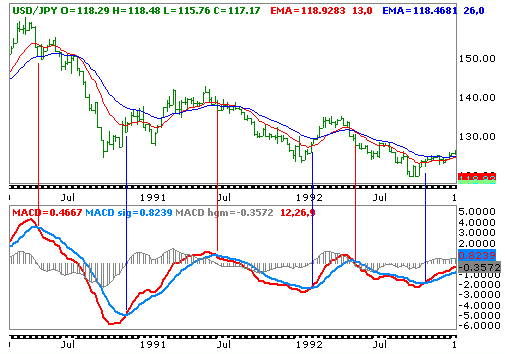
Let us take a look at the MACD plot on a weekly chart of USDJPY:
MACD 1
Broadly we would be pleased with the general signals being generated from MACD in this chart. While the crossover of the MACD across the signal line never really occur at market extremes, in this case they are pretty close and one cannot expect a lagging indicator to provide signals at price extremes.
It can be seen that before the moving averages cross the MACD is signaling a reversal earlier and allowing an early entry into a potential trade. Perfect. We can begin to trade on this indicator then… Or can we..?
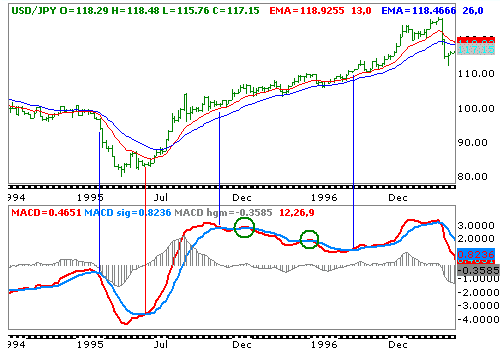
Take a look at the second chart, still the weekly chart of USDJPY but from a year or two later:
MACD 2
At first it looks quite good. MACD signals a sale into the large decline to the historic 79.70 low and a little later a reversal higher. There is lots of profit to be taken there. However, watch as the MACD peaks out soon after the initial rally from the 79.70 low. The two exponential moving averages continue to point higher and indeed do not cross lower until after the 147.65 peak. However, MACD spends around one year in a decline while price has continued to rally.
This is a recipe for losses.
Why is it that MACD can provide such a bad signal since it is based on two exponential moving averages?
The answer lies in the name: Moving Average Convergence and Divergence.
While the exponential moving averages are rising, the trend has slowed to the point that while only slightly the averages are converging – that is, moving closer together and this has caused the MACD to cross below the signal line.
Well, is there any way to control the trades to make sure that we do not make those trades? Indeed. One of the best tips I can offer is to remember the definition of a trend. An uptrend is where both highs and lows are moving higher. Thus, until the most recent low s broken there is no break/reversal of the trend.
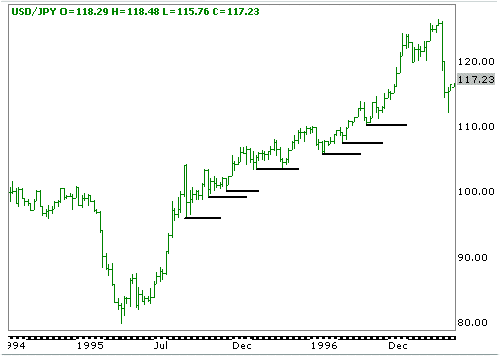
Let us look at how this would have worked:
MACD 3
As can be seen, I have drawn a horizontal line under each successive swing low. At no point is one of these broken until after the final high to the upper right of the chart. Thus, by combining information garnered from the price chart you can avoid many loss making trades.Good luck !

My essential trading system

If you want to get to the top of the forex market “food chain” you have come to the right place. The strategy that we are about to reveal to you is a completely new, efficient and reliable trading strategy that comes as the result of years of forex market research using sophisticated mathematical methods and is based on a fundamental property of financial markets.

Regardless of how strong a long-term market trend is, the market never moves only in the direction of the long-term trend - there are always minor movements against the longterm market trend. These deviations usually don’t last very long and after them the market moves again in the direction of the long-term trend.
The picture above shows a snapshot of a E/U candlestick chart. Although the market shows both upward and downward market movements it can be easily recognized that the long-term market trend is clearly bearish.

Frequent relationships are 25%, 38%, 50%, 61% and 75% (Fibonacci ratios).
Suppose we entered the market short and the market move into our direction and reached the point (1).
However, after that the market starts an upward movement toward point (2). What to do now ? Inexperienced trader would like to close the position, happy to take small profit.

This would be the wrong decision because the market turned back to it's main direction afterwards....
Just an example but you will meet above situation frequently, the essential question is : When do we decide that our trade has run out of steam and should be exited ?

This is where our strategy come into play. We have used the phenomenon described above as a starting point to develope a complete original and until now the best trading system that combines basic principles of Elliot Wave theory together with well-know properties of Fibonaci rates. The result is amazing, as you will soon find out. It will help us find the best possible time to exit the trade and extract maximum profit from the market !
Tobe continued ...... Continue here
Author : Nicolebobbin