Stochastics are often used to generate buy and sell signals when the %FastD crosses above or below %SlowD. Just how good are these signals?
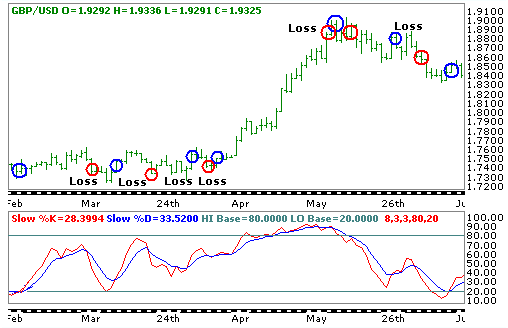
The stochastic plot here shows where entries are indicated:
 I have not circled all the signals but just four in the center of the chart that only shows the stochastic plot. The buy signal occurs when %FastD crosses above %SlowD and the sell signal occurs when the opposite is seen – when the %FastD crosses below %SlowD. However there are two other signals in between that provide first a sell signal and then a buy the next bar. This is rather annoying.
Let us seen how the entries might look on a chart.
 Clearly, when there is a modestly sustained move the Stochastic crossovers can provide a reasonable profit but all too often in the small, rather tight range consolidations it can give back much too much of hard earned profits.
Is there any way we can try and prevent this give back? I tend to consider the plain signals provided by momentum indicators as too simple and in a way that doesn’t really fully take price development into consideration. Does a reversal of the %FastD through %SlowD constitute a directional reversal? Personally I do not think so.
Then what does represent directional reversals? Well, if you go back to a fundamental premise on what constitutes a trend it can be defined by looking for higher highs and higher lows in an uptrend and vice versa for a downtrend. If we then just trade without looking at the price chart just because %FastD has crossed through %SlowD then we’re really not think about what we’re doing. Quite often price can see a one or two bar reversal but not to the extent that it penetrates the most recent sequence of higher lows (in an uptrend) or lower highs (in a downtrend.)
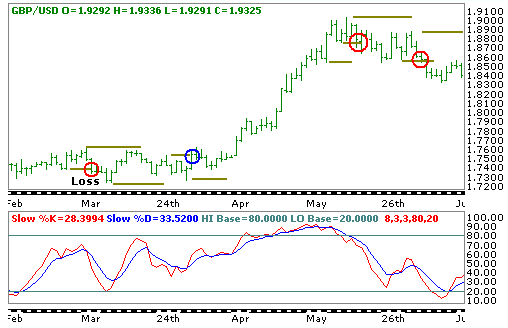
What we can do is stipulate that we’ll only buy on a Stochastic cross higher if price penetrates the last swing high, or if the Stochastic crossover is lower then on the breach if price penetrates the last swing low:
 You can see by doing this it does reduce the number of trades dramatically but actually takes out most of the losing trades. The first short sell to the bottom left of the chart will produce a loss – but this is compared to 6 losing trades without the price filter. The long trend is kept intact in the center of the chart as price rallies and is reversed soon after the peak. We then see two sell signals with no buy signals.
The techniques is not foolproof, as any methodology has its weak points at times, but it can be seen that using a price signal along with a momentum signals can dramatically reduce the number of losses you may need to take on using such a strategy.


